So, I massaged the data into a more usable format, a tall table, where there are only 3 columns (later renamed 'swimmers' to 'visits' ) and a date is a date rather than combination of month name and year in different columns:

Then read that into Tableau Public, and started exploring the data (dashboards)
First tab: Line charts
Line charts are quite good for example for comparing how similar (or not!) past years have been (Total visits). Also, I think the power of small multiple charts is very visible in the Visits by place chart: when the scales of each chart are the same, it is easy to check those only once. Then the effort can be put on studying the actual matter ie how swimming pools and/or years compare.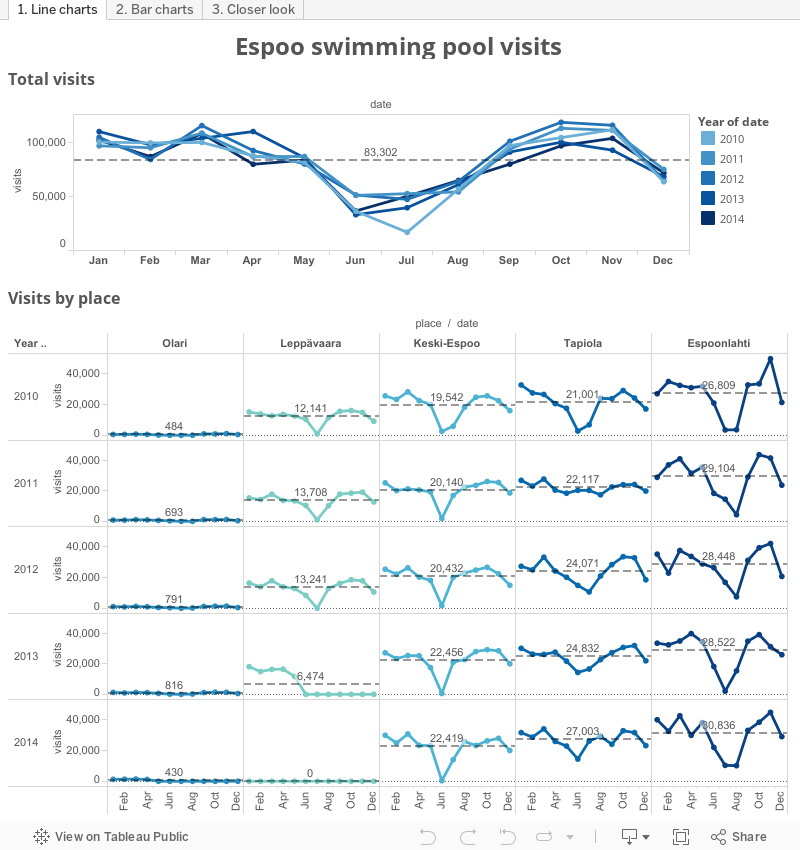
It could be argued that it is not necessary to have a different colour for each place ie swimming pool as the columns already have the names. Frankly, I just though it looks nicer that way :-)
Anyway, you can spot many things from the above charts. For example, visits drop a lot during summer months. I happen to know that the swimming pools are closed for some period of time each, not necessarily for a full calendar month. But would there be visitors also during summer if the pools were kept open? At least in Tapiola the visits look quite steady on 2011, from April to August.
Second tab: bar charts
Leppävaara swimming pool was closed for renovation on summer 2013. Could the data tell what happen to the visitors that used to go there?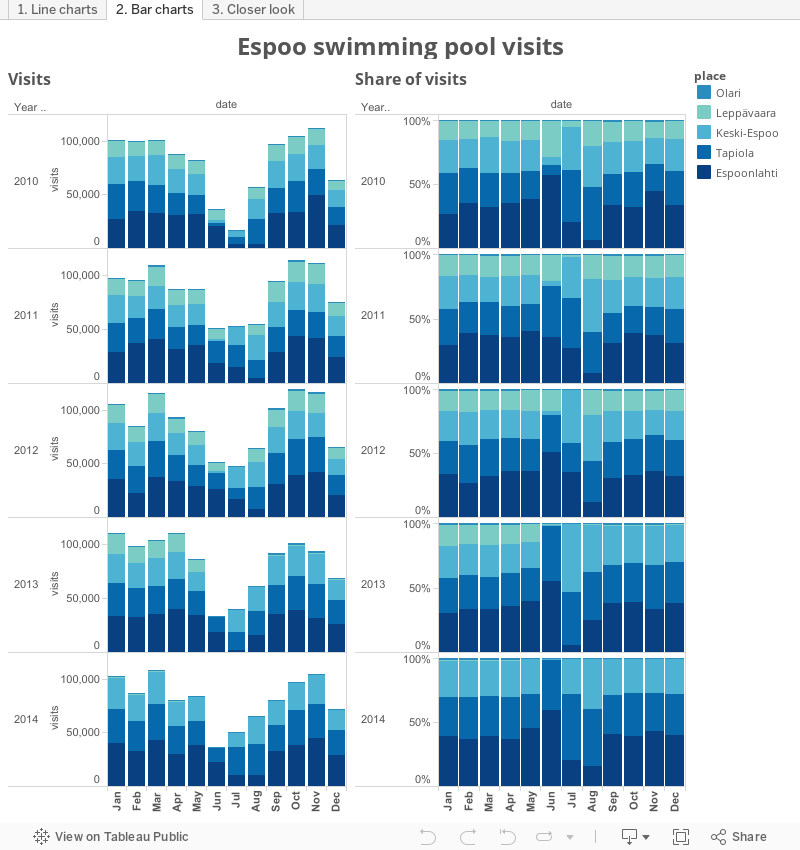
Left side shows the actual visits as stacked bar chart and the right side shows the share of visits per pool, summing up to 100% for each month. Leppävaara's share of visits has been about 15% of total month visits (excluding summer months), but after May 2013 visits went to zero. Looking at second half of 2013, from perhaps September onwards, it looks the shares are roughly equal between the remaining pools (I excluded Olari as it is so small). However, looking at total visits, perhaps the visits declined?
Third tab: closer look
As the seasonality is so strong, I decided to compare the 12 months before close of Leppävaara swimming pool to the next 12 months.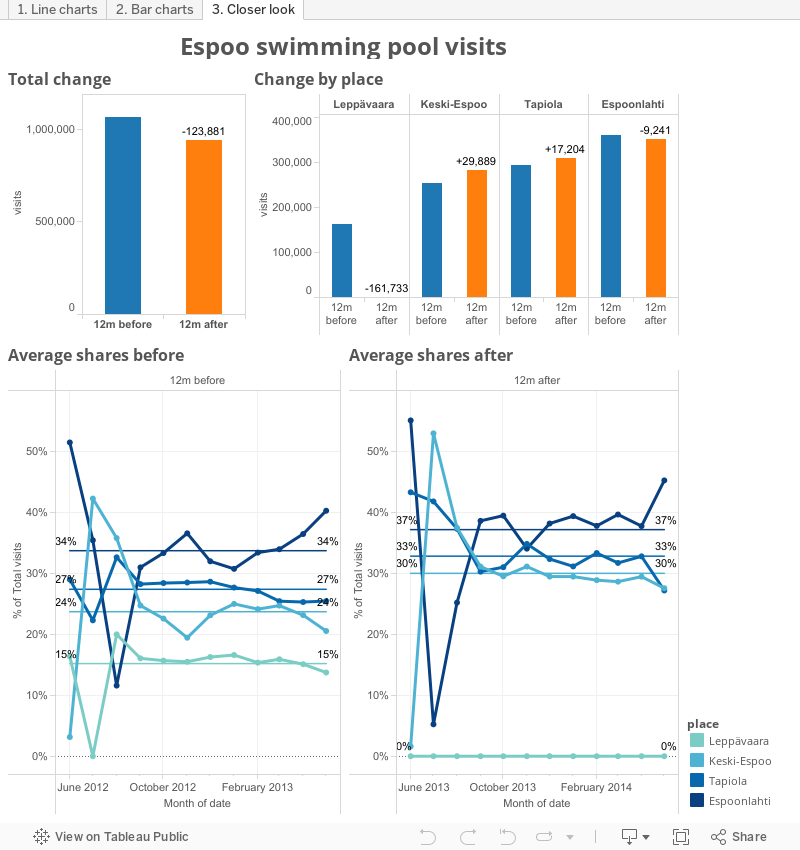
Top row of charts shows how in total there were 120 000 visits less after the closing. So not all of Leppävaara's visits were lost (160 000), but a huge number still. Keski-Espoo and Tapiola number of visits were increased (+30 000, +17 000).
Bottom row shows with more detail how the monthly visits were spread between pools before and after Leppävaara closing. The included averages of monthly shares show how Espoonlahti has the highest share of visits, even if the total number of visits decreased.
Leppävaara pool is planned to be opened early 2016, with larger capacity and an outdoor pool for summer. Hopefully the 'lost' swimmers and many more do then return!
I am very amazed by the information of this blog and i am glad that i had a look over the blog.
ReplyDeleteswimming pool chemicals
Where should I go for a PADI IDC course?
ReplyDeletePADI IDC Gili Islands
Thanks for the information and links you shared this is so should be a useful and quite informative!
ReplyDeletedive cancun